
Complete Guide to Neighbourhood Market Trends
Did you know that Ontario’s real estate market saw prices change by over 20 percent in some regions last year? Shifts like this create both opportunity and uncertainty for buyers and sellers. Understanding why one neighbourhood thrives while another slows can mean the difference between making a smart investment or missing out. Gaining insight into these patterns reveals the forces shaping each community’s market, from employment rates to local development and more.
Table of Contents
Key Drivers Of Real Estate Price Changes
City Comparison: Toronto, Ajax, Whitby, Pickering, Oshawa
How To Read Market Statistics And Reports
Common Mistakes When Interpreting Market Trends
Key Takeaways

Defining Neighbourhood Market Trends in Ontario
In Ontario, neighbourhood market trends reflect nuanced dynamics that extend beyond simple price fluctuations. Real estate experts in Toronto and surrounding areas observe that factors such as local infrastructure development, employment rates, and proximity to amenities significantly influence property valuations. These elements create micro-markets within larger urban and suburban landscapes, where each neighbourhood can experience distinct economic trajectories.
- Economic uncertainty drives regional price variations
- Local infrastructure impacts property values
- Employment opportunities shape housing demand
- Demographic shifts influence neighbourhood attractiveness
Key Drivers of Real Estate Price Changes
The landscape of real estate pricing is not uniform, with multiple interconnected variables influencing market trends. Insights from economic research reveal that macroeconomic conditions, trade dynamics, and regional economic health significantly impact property values. Urban centres like Toronto experience more pronounced price fluctuations compared to smaller Ontario communities.
Key drivers of real estate price changes include:
- Interest rate variations
- Local economic development
- Population growth and migration patterns
- Employment market stability
- Infrastructure investment
City Comparison: Toronto, Ajax, Whitby, Pickering, Oshawa
Toronto stands apart as the metropolitan hub, typically experiencing more volatile pricing and higher average property values compared to surrounding suburbs. Local market insights reveal that Ajax, Whitby, Pickering, and Oshawa offer more affordable alternatives while maintaining proximity to Toronto’s economic opportunities. The Matt Phillips Team’s May 2025 research highlights significant price differentials between these municipalities and the Greater Toronto Area.
Key comparative metrics for the region include:
- Average home prices
- Days on market
- Sales volume
- Selling price to list price ratios
- Local economic infrastructure
 Here’s a comparison of key real estate market metrics across Toronto, Ajax, Whitby, Pickering, and Oshawa:
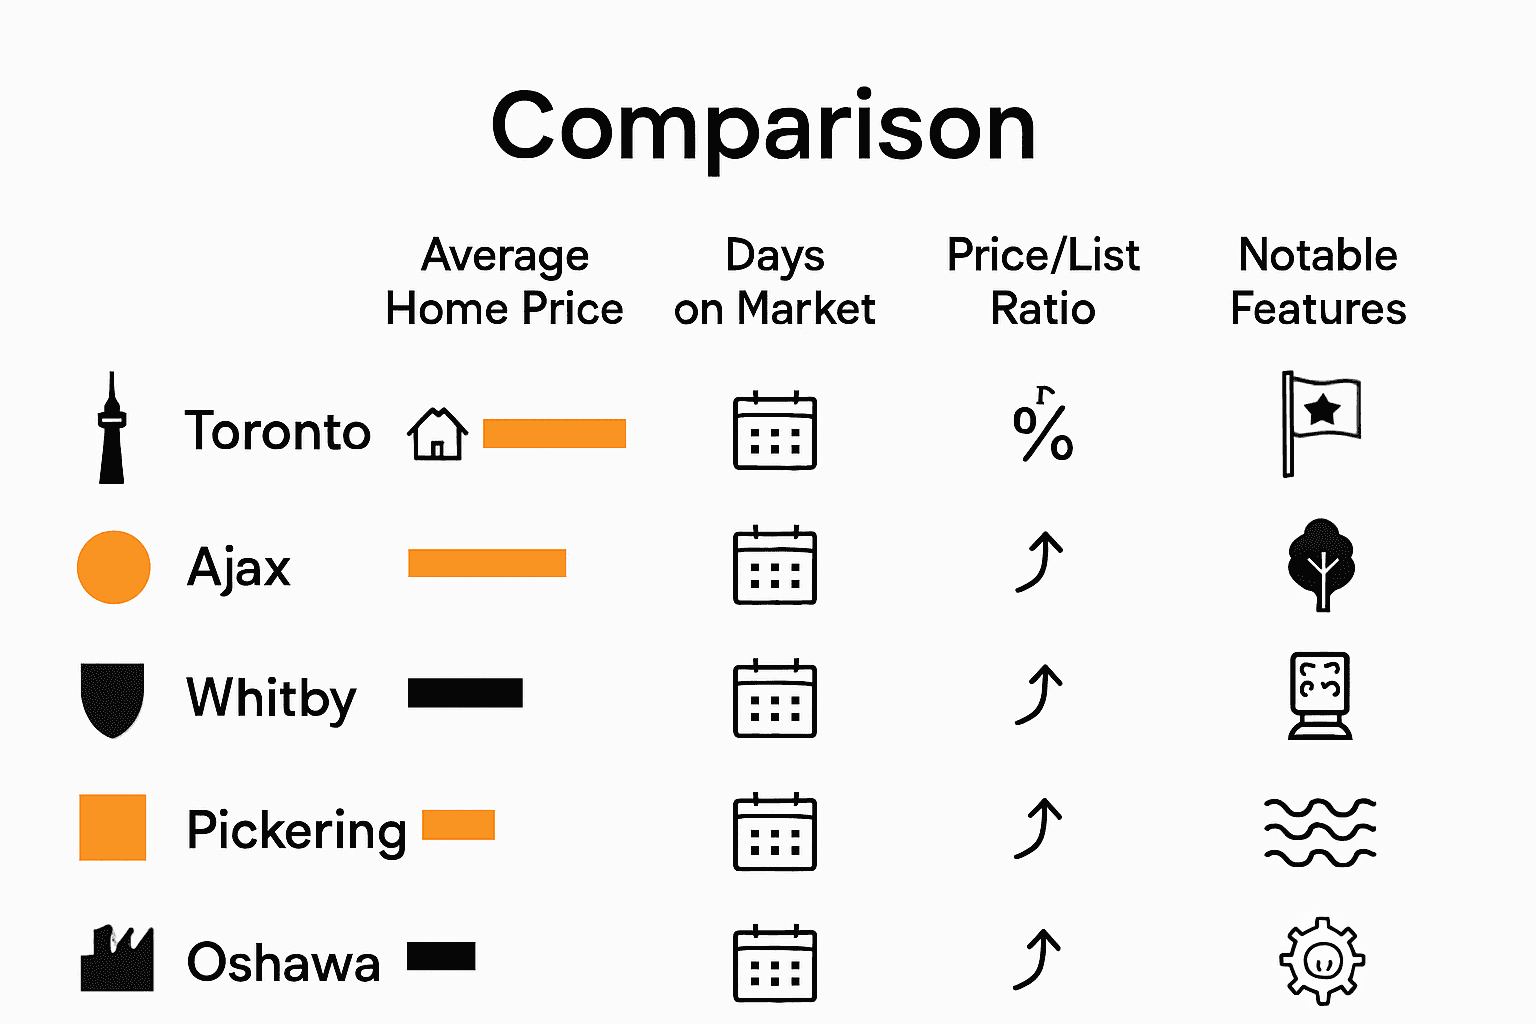

How to Read Market Statistics and Reports
Market research from Wowa highlights critical metrics that help investors and homebuyers interpret market conditions. Sales-to-new-listings ratios, month-over-month comparisons, and year-over-year trends provide a nuanced view of market dynamics, distinguishing between balanced markets, buyer’s markets, and seller’s markets.
Key components to understand when reading market reports include:
- Benchmark pricing
- Sales volume trends
- Inventory levels
- Days on market
- Price-to-list ratios
- Seasonal market variations
Common Mistakes When Interpreting Market Trends

Global Property Guide research highlights the dangers of overgeneralizing short-term market fluctuations.
Seasonal cycles, temporary economic disruptions, and localized events can create misleading snapshots that do not represent long-term market trajectories, especially when comparing diverse neighbourhoods with unique economic characteristics.
Common interpretation mistakes include:
- Assuming uniform market conditions across regions
- Overlooking seasonal market variations
- Misinterpreting short-term price fluctuations
- Ignoring broader economic context
- Failing to consider neighbourhood-specific factors
- Relying on a single data source
Navigating Oshawa and Surrounding Area Neighbourhood Market Trends with Expert Guidance
Take control of your home-buying or selling journey today. Fanis Makrigiannis offers personalized strategies tailored to your unique goals in Toronto and the Durham Region.

Discover detailed neighbourhood insights, access up-to-date listings, and receive expert advice on interpreting market trends at Fanis.ca. Act now to gain the clarity and confidence needed to make informed decisions in this evolving real estate landscape.
Frequently Asked Questions
What are the main factors influencing neighbourhood market trends?
How can I interpret real estate market statistics effectively?
What common mistakes should I avoid when analyzing market trends?
How do economic factors impact real estate prices?
About the author:

Fanis Makrigiannis is a trusted Realtor with RE/MAX Rouge River Realty Ltd., specializing in buying, selling, and leasing homes, condos, and investment properties. Known for his professionalism, market expertise, and personal approach, Fanis is a Real Estate agent in the Durham region and is committed to making every real estate journey seamless and rewarding.
He understands that each transaction represents a significant milestone and works tirelessly to deliver outstanding results.
With strong negotiation skills and a deep understanding of market trends, Fanis fosters lasting client relationships built on trust and satisfaction.
Proudly serving the City of Toronto • Ajax • Brock • Clarington • Oshawa • Pickering • Scugog • Uxbridge • Whitby • Prince Edward County • Hastings County • Northumberland County • Peterborough County • Kawartha Lakes
Recommended
Toronto’s Real Estate Market 2025: Trends & Insights - Fanis Makrigiannis Realtor®
Top Popular Toronto Communities for Homebuyers & Investors 2025 - Fanis Makrigiannis Realtor®
Best Neighbourhoods to Sell in Toronto & Durham 2025 - Fanis Makrigiannis Realtor®